Why is Economic Mobility So (Surprisingly) Low in North Carolina?
Craig Richardson, Ph.D.
Winston-Salem State University
Volume 1, Issue 1
Click the Button Below to Download a PDF Version of this Issue Brief
Executive Summary
The odds of climbing up the economic ladder, otherwise known as economic mobility, differ quite dramatically depending on where one lives. Compared to northern states, economic mobility is far lower in the South, and North Carolina suffers from some of the worst economic mobility in the nation. Cities like Charlotte, Winston-Salem, and Greensboro are leaving some of their poorest residents behind, despite overall strong economic growth. What can be done to improve upward mobility for the least advantaged? This paper details how a new research center at Winston-Salem State University is combining researchers from multiple fields to bring forward an alternative approach to poverty. This approach highlights the need for initiatives that create wins for business, residents and government in order to overcome stymied public policies that pit one group against another. With public transit, for example, the center’s research yields surprising findings about the high opportunity costs of their long commutes. The enormous use of time spent commuting by public transportation acts like a tax on poor people’s time, and it has never been measured before. This approach may serve as a blueprint for other cities coping with low economic mobility.
Why care about economic mobility?
For the past number of years, Stanford economist Raj Chetty and his research team have been exploring a fundamental question: Is the American Dream still possible in the United States? That is, if you are born poor, what are the odds of getting out of poverty? If we define the poor as the bottom 20 percent of household income, then Chetty investigated how difficult it would be for the next generation to move up the economic ladder to a higher income quintile, or level of income. [1]
Chetty’s perspective was to measure economic mobility in terms of relative gains, rather than absolute gains. Measuring economic mobility in absolute terms (whether or not you have more dollars than your parents) versus relative terms (whether or not you are moving up in income faster than others are) provides different perspectives, both of which are valid. For example, a study by the Pew Charitable Trusts used a panel study that compared family incomes of children to parents, adjusted for inflation. About 84% of Americans in the early 2000s surpassed their parents’ income by at least a dollar. [2] However, because of the wealth of data provided by Chetty el.al. across states and counties, we focus on relative economic mobility gains in this paper.
Looking at Figure 1, for example, we see that relative economic mobility differs quite dramatically depending from one county to the next. Figure 1 is a heat map that shows the financial penalty of growing up in certain counties across the country versus others. With lower economic mobility, people in these counties stand a far lower chance of climbing the economic ladder to higher income quintiles.
Figure 1:
Heat Map of Economic Mobility Across Metro Areas in the United States [3]
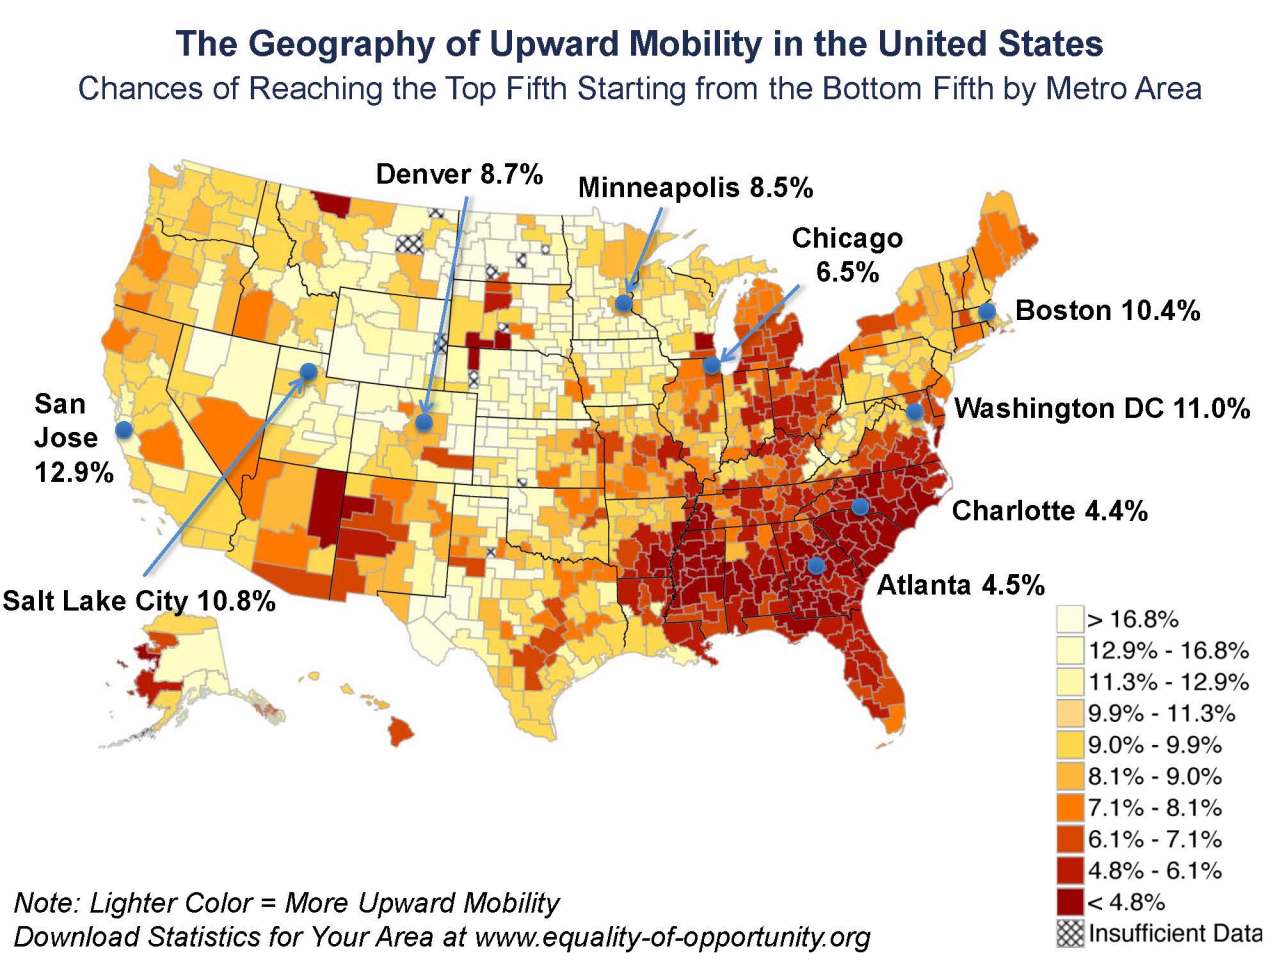
What is immediately evident from Figure 1 is that the low economic mobility is particularly evident through the deep South up to Texas, in a large sweeping red swath. Other troublesome areas include the so-called Rust Belt in Ohio and Michigan, as well as Indian reservations in Arizona and South Dakota.
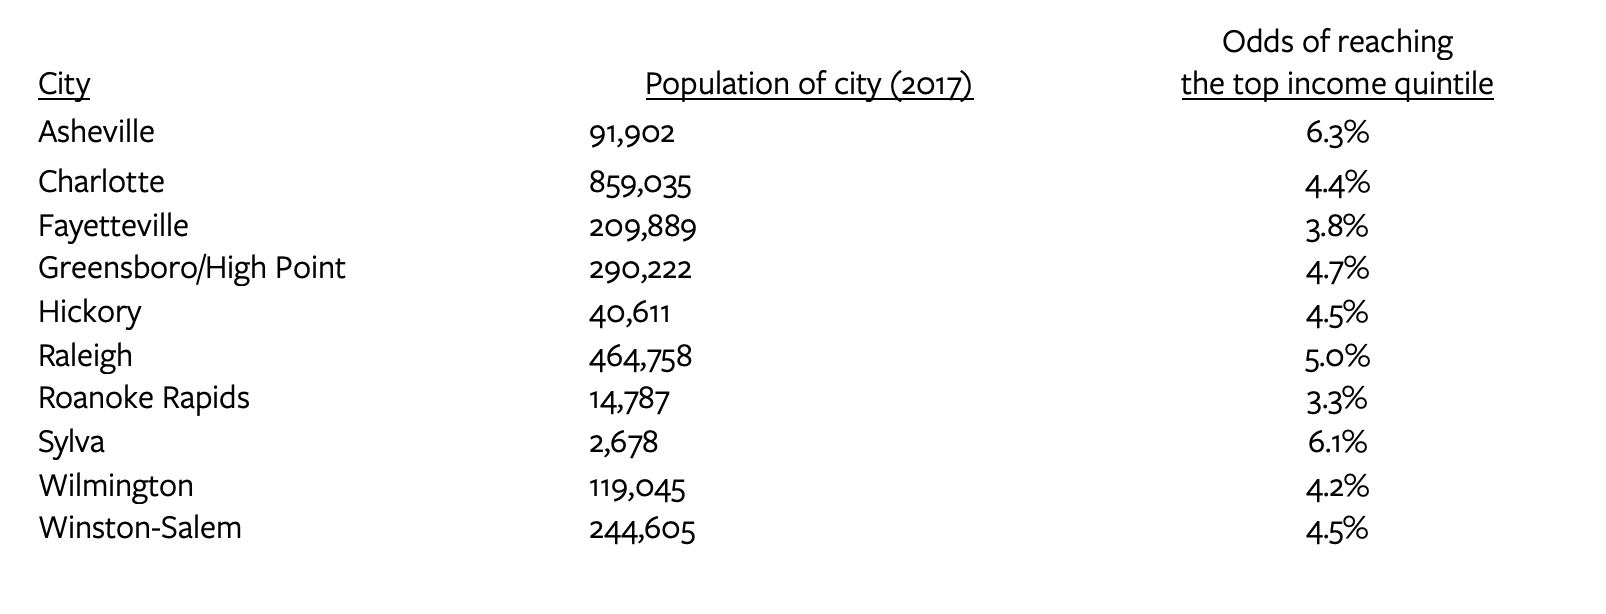
Areas with higher economic mobility have five characteristics in common: lower levels of residential segregation, a larger middle class, stronger families, greater social capital, and higher quality public schools.[4] What is surprising is how poorly North Carolina does in economic mobility. In Chetty’s dataset of 729 metro areas, Charlotte, NC is ranked 19th from the bottom, tied with Tupelo, MS and Dyersburg, TN. Winston Salem is tied at 20th from the bottom with eight other cities. The odds of getting out of the bottom 20th percentile in Winston-Salem is just 4.5%. Compare that to San Jose, CA at 12.9%, Salt Lake City at 10.8% and Washington, D.C. at 11.0%. Other cities in western North Carolina, such as Asheville and Sylva, fare only slightly better as seen in Table 1 below.
Table 1:
Chances of reaching the top income quintile, starting at the bottom quintile, selected North Carolina cities
For the United States overall, the average probability of climbing from the bottom to the top quintile is 10.0%. Notably, six of the top ten highest ranked cities are in North Dakota, with two located in South Dakota and two in Montana. The odds in that group range from Glendive, MT (26.7%) up to Bowman, ND at 47.0%. [5]
North Carolina’s low ranking is particularly surprising since the state exhibited the sixth fastest growth in the 1990s, according to a 2000 Brookings report. The report noted the high accolades in the popular press. For example, Forbes magazine ranked 200 best metro areas by wage, salary, job growth, and increases in high tech clusters. Charlotte was 14th, Raleigh was 21st, and Wilmington was 35th in the country. Money magazine’s, “The Best Places to Live, 2000” ranked Raleigh-Durham 2nd, Greensboro/Winston-Salem 11th, and Charlotte 12th among large metropolitan areas in the South. [6]
Yet despite high growth across the state and popularity of its large metropolitan areas, less attention gets paid to many areas in North Carolina that might be better known as “the tale of two cities.” Out of sight of the construction cranes and booming downtowns in places like Winston-Salem, Charlotte, and Raleigh are poverty-stricken areas that are growing ever more concentrated with poor people.
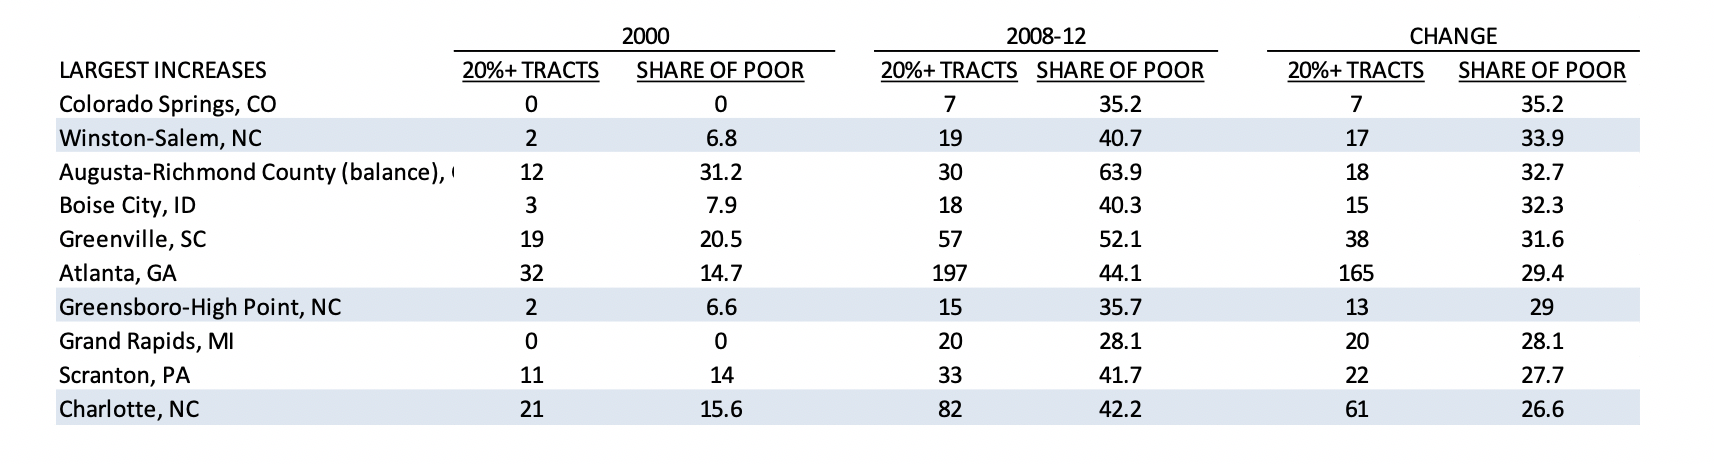
Recall that Chetty and his colleagues concluded that one of the key barriers to economic mobility is residential segregation. A 2014 Brookings report studied the growth in concentrated poverty by measuring the number of Census tracts that had more than 20 percent of the families living below the poverty line. As seen in Table 2, in the year 2000, Winston-Salem, NC had only two Census tracts with more than 20 percent of families below poverty. In other words, most poor families in 2000 were likely to be in the same Census tract as lower middle class and middle-class families.
Table 2
Cities with Biggest Increases in Concentrated Poverty [7]
There are benefits to this kind of economic integration. When there are families of different income levels living in the same neighborhood, the way up the economic ladder for the poorest families is more tangible and easier to visualize. Moreover, their children will have access to higher quality school districts than those in poverty-stricken areas. In addition, network effects increase regarding employment opportunities through informal gatherings such a PTA meetings, local children’s soccer games or neighborhood get-togethers.
After the 2008 Great Recession, poverty became far more concentrated in some of the larger cities in North Carolina. In Winston-Salem, the number of Census tracts with greater than 20% of families in poverty increased from 2 in the year 2000 to 19 in 2008-12. This means that low income residents are grouped in these poverty pockets, rather than sprinkled across the city in multi-income areas (as seen in Table 2). No other city in America except Colorado Springs saw a larger share of poor families become concentrated into the same areas. Two other North Carolina cities also make the list of the nation’s greatest changes in concentrated poverty: Greensboro-High Point and Charlotte, NC. No other state has three cities on the list.
Tackling low economic mobility in North Carolina: A new research center’s approach
The troublesome statistics illustrated in this paper led to the launch of a new academic center in the fall of 2017 at Winston-Salem State University, located in Winston-Salem, North Carolina. Launched in 2017 with funding from the Washington, D.C.-based Center for Advancing Opportunity, the Center for the Study of Economic Mobility (CSEM) seeks to explore any issues relating to economic mobility in its resident Forsyth County, North Carolina.[8] The hope is that by finding answers about the area’s lack of economic mobility, this will serve as a blueprint for other cities in North Carolina and beyond.
CSEM takes a unique multidisciplinary approach by reframing scientific inquiry to align the incentives of business, individuals, and government, otherwise known as its B.I.G. idea. What are those incentives that improve the likelihood of idea adoption? Businesses want more profits, individuals want more income, and government wants higher net tax revenue or accolades from the public. By aligning incentives of all stakeholders, with “win-win-win” as a potential outcome, the odds increase substantially of framing government policies that drive upward economic mobility. This perspective helps research programs anticipate pushback from any of the three sets of stakeholders.
CSEM has funded seven different research tracks, including faculty from the fields of economics, transportation, geography, psychology and education. A separate advisory board, composed of representatives from local non-profit foundations as well as campus representatives, makes recommendations for faculty funding each year. Each research question is framed holistically with all three stakeholders in mind. The result is localized empirical research that is aimed at improving both short-term and long-term economic mobility for the poorest citizens in Forsyth County, North Carolina, and beyond.
Transportation and economic mobility – one path to investigate
CSEM researchers have identified transportation as a key barrier to upward economic mobility. Access to reliable and safe transportation is critical for success in the modern economy. Being physically mobile allows for the access of a wider variety of jobs, hours worked and opportunities for promotion. Without a personal vehicle, these choices become far narrower. Public bus users are limited to jobs located near bus routes, or at least within reasonable walking distance. To make things worse for those without cars, the website Walkscore.com ranks Winston-Salem at the very bottom of all cities with populations between 200,000 and 350,000, in terms of walkability and biking.
For this reason, in late 2018, CSEM surveyed 215 employed bus riders using the Winston–Salem Transit Authority (WSTA) bus system to learn more about their lives and missed opportunities. The survey was a random, stratified and weighted sample in order to get a representative picture of employed bus riders across most of the routes. Driving the survey were many questions about wages, missed job opportunities, changes in behavior in relation to food choices, medical care and alternative employment opportunities. CSEM researchers asked respondents for actual numbers rather than ranges in order to calculate riders’ time costs with more precision.
Notably, the WSTA bus fare has been unchanged since 1998, at $1 per trip- which has survived various calls for price increases. However, the time costs of bus riders have never been measured, which can give a better glimpse into the hurdles for rising up the economic ladder.
As Table 3 shows, there are tremendous differences in commute times for taking the bus compared to traveling by car, as reported by bus riders. Overall, bus riders spend 8.6 extra hours per week riding the bus, compared to how much time they report it would take to get directly to work by car. This is essentially akin to a sixth day of work that goes unpaid. The monetary value of this hidden “time tax” can be measured using the average wage rate as a good approximation for potential lost wages.
Table 3:
Time Tax of Public Transportation: Commuting to and from Work in Winston-Salem, NC [9]
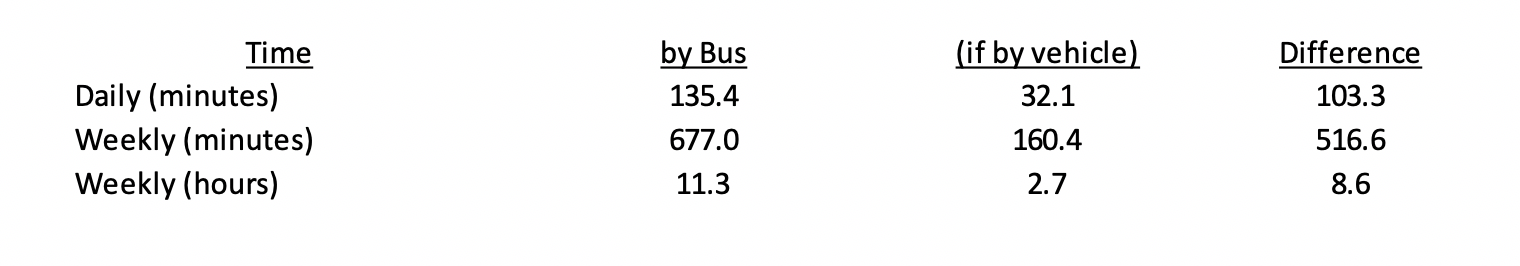
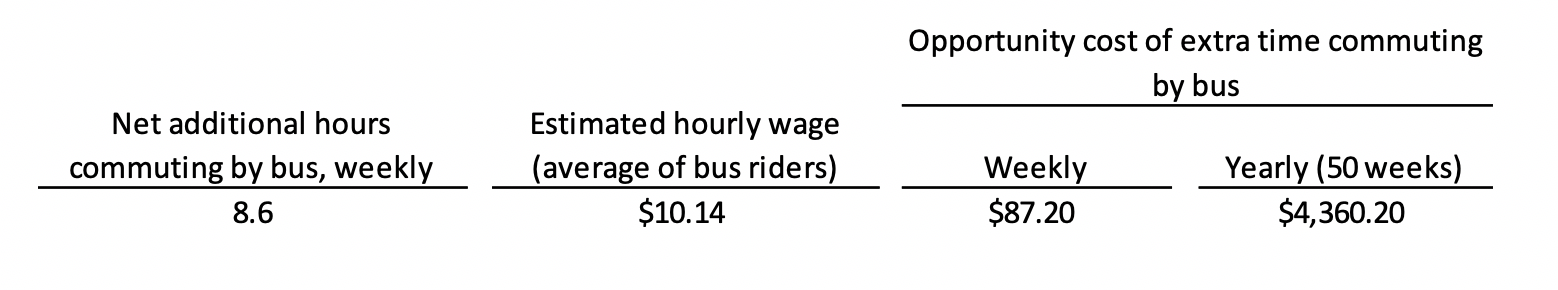
Table 4 shows that the potential lost wages are substantial for an individual working full-time, typical for most employed bus riders. With a surveyed average wage of $10.14, individuals are missing out on $87 per week, $348 per month or $4,360 per year. This does not take into account the operating costs of a vehicle or taxi fares. However, by framing the analysis in this way, we open discussion for multiple ways to lower commute times, which could range from improving the bus system, subsidized ride-sharing such as Uber/Lyft, private company vans, or even electric bikes or scooters. [10] The point is to reveal that time is by far the largest cost, and ways to lower that commute time can only improve the odds of moving up the economic ladder.
Table 4:
Dollar Value of the Public Transportation Time Tax in Winston-Salem [11]
There are other ripple effects to long commutes as well. In the engaging book, Scarcity (2013), we learn when time becomes more scarce, it reduces a person’s ability to retain information, engage in logical reasoning, plan ahead, and control impulses. This operates like a tax on one’s bandwidth, or ability to process a broad range of decisions. Studies indicate that this “bandwidth tax” does not reduce a person’s inherent mental capacity, but rather the capacity available for use, much like an over-taxed computer-processing chip with too many apps running.[12] This makes it more difficult to think about strategies for moving up the economic ladder. Combined with living in areas of concentrated poverty, the behavior can become self-reinforcing.
What is clear is that both the time tax and the bandwidth tax faced by public bus riders in Winston-Salem are rarely, if ever, directly measured by government officials when deciding on the best approaches to lift people out of poverty. That leads to public policy solutions that sharply discount the value of time for those at the bottom of the economic ladder.
Moving people out of poverty must be more than a “triage” approach
Economic mobility in North Carolina remains a central challenge, all the more so because those on the lowest rungs of the economic ladder remain increasingly hidden from view as the concentration of poverty increases in major cities. Work at the Center for the Study of Economic Mobility (CSEM) at Winston-Salem State University is focusing on innovative ways to move people up the economic ladder, by moving from a triage model of “poverty alleviation” to a model of individual empowerment. By studying the visible and invisible costs of poverty, CSEM is working to create solutions that align the incentives of business, individuals and government. Future pilot studies will investigate and offer potential “win-win-win” solutions that potentially leverage private/public partnerships in order to ensure the greatest chance of success for those at the bottom of the economic ladder.
About the Author
Craig Richardson is BB&T Distinguished Professor of Economics at Winston-Salem State and the Founding Director of the Center for the Study of Economic Mobility (CSEM). He has a long-standing interest in the causes of economic growth and decline, property rights, and international economics. He has published in numerous peer reviewed journals, as well as media outlets such as The Wall Street Journal, Barron’s, and Forbes. Email: richardsoncr@wssu.edu. Website: www.wssu.edu/csem.

_______
Footnotes
- An income quintile is a measure of socioeconomic status that divides the population into 5 income groups (from lowest income to highest income) so that approximately 20% of the population is in each group.
- Julia Issacs, “Economic Mobility of Families Across Generations,” Economic Mobility Project, Pew Charitable Trusts, 2016, pp. 1-17. https://www.brookings.edu/wp-content/uploads/2016/06/11_generations_isaacs.pdf. Parents’ income is from 1967–1971. Children’s income as adults is taken from 1995–2002. Isaacs writes: “Family cash income is the focus of the analysis, including taxable income (such as earnings, interest and dividends) and cash transfers (such as Social Security and welfare) of the head, spouse and other family members… As discussed in Appendix B, family cash income does not include the value of non-cash compensation such as employer contributions to health insurance and retirement benefits, nor does it include the effect of taxes or non-cash benefits such as food stamps. All incomes are reported in 2006 dollars, using the CPI-U-RS to adjust for inflation.”
- Raj Chetty, “The Impacts of Neighborhoods on Economic Opportunity: New Evidence and Policy Lessons,” Presentation to Brookings Institution, June 1, 2015. https://www.brookings.edu/wp-content/uploads/2015/06/Brookings-slides-for-web.pdf.
- Raj Chetty, Nathaniel Hendren, Patrick Kline and Emmanuel, “Where is the Land of Opportunity?”, Quarterly Journal of Economics 129(4), pp. 1553-1623, 2014.
- The probability statistics and Table 1 were generated from Chetty, et. al., using information from Online Data, Table 6 in “Where is the Land of Opportunity? The Geography of Intergenerational Mobility in the United States”, Descriptive statistics. Available at: http://www.equality-of-opportunity.org/data/.
- Center on Urban and Metropolitan Policy and Bruce Katz, “Adding It Up: Growth Trends and Policies in North Carolina., Brookings Institution: Washington, D.C. July 1, 2000. Available at: https://www.brookings.edu/research/adding-it-up-growth-trends-and-policies-in-north-carolina/
- Elizabeth Kneebone, “The Growth and Spread of Concentrated Poverty, 2000 to 2008-2012., Brookings Metropolitan Opportunity Series, July 31, 2014. https://www.brookings.edu/interactives/the-growth-and-spread-of-concentrated-poverty-2000-to-2008-2012/.
- Headquartered in Washington, D.C., the Center for Advancing Opportunity (CAO) is a research and education initiative created by a partnership with the Thurgood Marshall College Fund, the Charles Koch Foundation, and Koch Industries. CAO supports faculty and students at Historically Black Colleges and Universities (HBCUs) and other postsecondary institutions to develop research-based solutions to the most challenging issues in education, criminal justice, and entrepreneurship/economic mobility. CSEM is guaranteed academic independence and freedom by its donors and Winston-Salem State University. As noted on the CAO website, “Our constituency is people living in fragile communities and they are members of all races, ethnicities, and religions. See: https://www.advancingopportunity.org/our-story/.
- Source: Fall 2018 CSEM survey of 215 Winston-Salem employed bus riders.
- Zachary D Blizard, “Economic Mobility in Winston-Salem/Forsyth County, NC: A Closer Look into Employed Bus Riders’ Lives, Ambitions and Missed Opportunities to Climb the Economic Ladder.” CSEM Working Papers in Transportation Series, no. 1: November. Published at Center for the Study of Economic Mobility, Winston-Salem State University, 2018.
- Source: Fall 2018 CSEM survey of 215 Winston-Salem employed bus riders.
- Sendhil Mullainathan, S. and Elr Sharfir (2013). Scarcity: The New Science of Having Less and How It Defines Our Lives. Picador: New York.
Further Readings
Adamy, Janet and Paul Overberg, “Struggling Americans Once Sought Greener Pastures- Now They’re Stuck,” The Wall Street Journal, August 2, 2017. Economic mobility used to be facilitated by people moving to locations offering better wages; now the country is the “least mobile since after World War II.” The author explores reasons why, and gives another dimension to the problem.
Leonhardt, David, “In Climbing Income Ladder, Location Matters,” The New York Times, July 22, 2013, p. A1. https://www.nytimes.com/2013/07/22/business/in-climbing-income-ladder-location-matters.html This article is an excellent introduction to economist Raj Chetty’s path-breaking work on economic mobility, with personal stories illustrating the difficulties faced by those living at the lowest income levels in New York City. Links to further information about economic mobility are helpfully provided.
Semuels, Alana, “Why It’s So Hard to Get Ahead in the South,” The Atlantic, April 4, 2017. https://www.theatlantic.com/business/archive/2017/04/south-mobility-charlotte/521763/ This article focuses on Charlotte, North Carolina and potential reasons why it does so poorly in economic mobility. The author focuses on state policy choices as the reason for Charlotte’s poor performance in this arena, although little focus is paid to longer term structural impediments to economic mobility that involve individual initiative.
Sharkey, Patrick, “Neighborhoods and the Black-White Mobility Gap,” Economic Mobility Project, Pew Charitable Trusts, 2009, pp. 1-44. Available at: https://www.pewtrusts.org/-/media/legacy/uploadedfiles/pcs_assets/2009/pewneighborhoods1pdf.pdf This paper outlines how being raised in a neighborhood in poverty has a huge impact on downward economic mobility for children’s economic future. Economic mobility thus has a geographic and spatial component that must be considered along with public policies aimed at individual opportunities.
Sharkey, Patrick and Gerard Torrats- Espinosa, “The Effect of Violent Crime on Economic Mobility,” Journal of Urban Economics, 102, November 2017, pp. 22-33. The authors show how growing up in areas of violent crime has a measurable downward impact on economic mobility, indicating that environment is another aspect aside from individual initiative.