There’s something interesting happening with North Carolina’s new coronavirus cases. The pattern was different in June than it has been so far in July, and we may be seeing the early signs of cases subsiding.
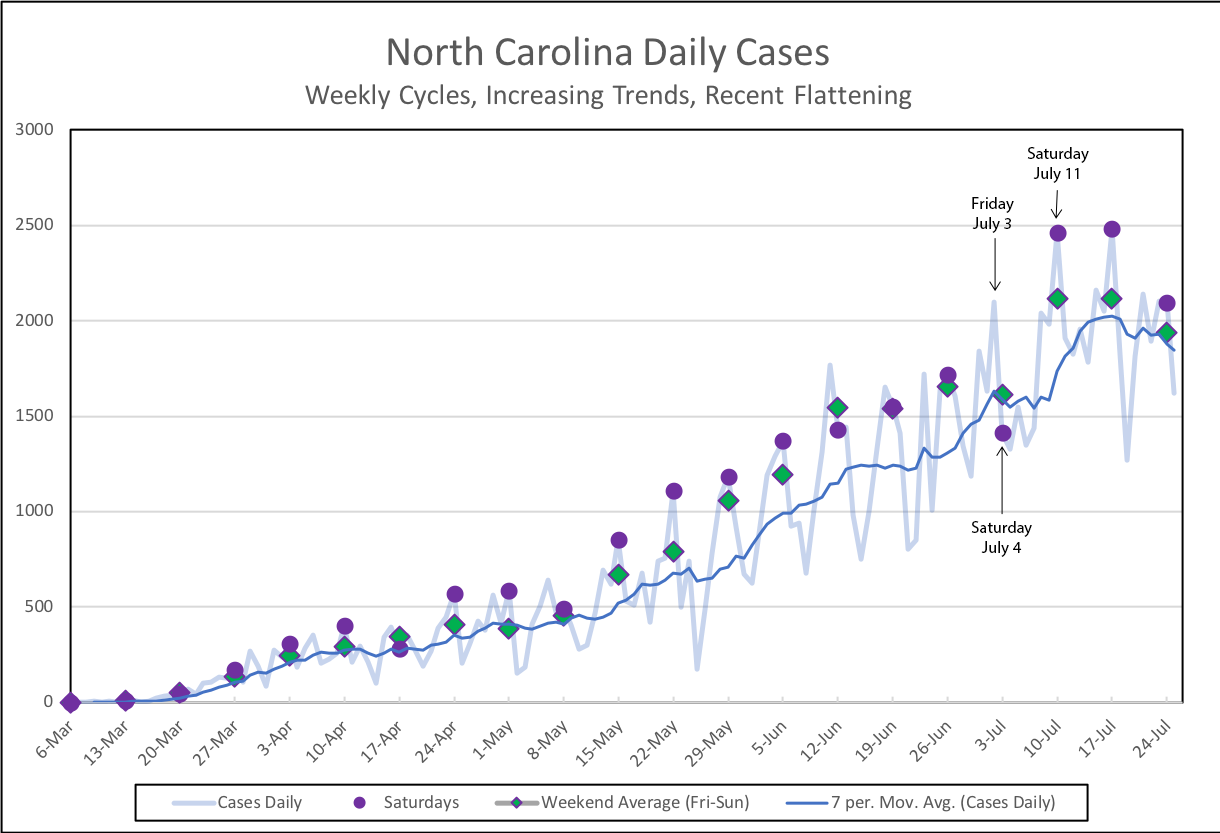

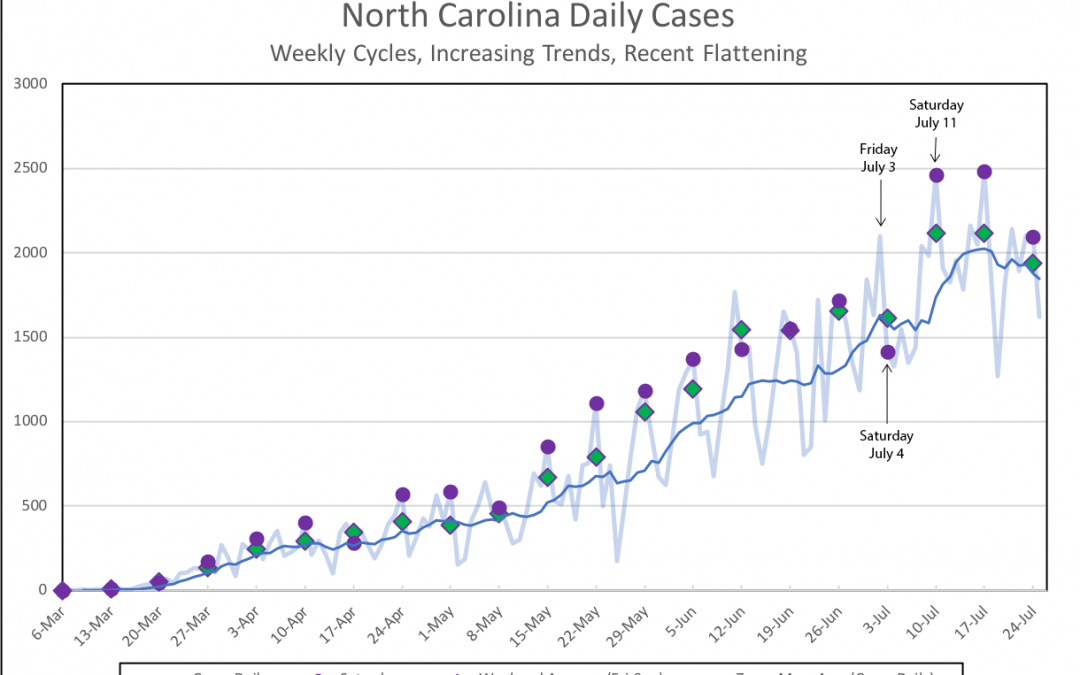
1. First, notice the sharp hi-lo weekly cycle in the data. North Carolina cases tend to peak on weekends, almost always on Saturdays. The purple dots on the chart mark Saturdays. The reason for these cycles has to do with work routines and staffing in the public health system, not the virus itself (more details available). My point here is to show the Saturday pattern exists, because yesterday on July 25 cases might have broken that pattern.
2. Starting at the weekend of May 9, North Carolina set new record high case numbers on nine consecutive weekends, through the weekend of July 11. These consecutive highs are pulling up the seven-day moving average for late May and June. That trajectory has been flat or negative since.
3. Actually the pattern broke trend before July 11, as a look at the July 4 weekend shows. While cases did peak to a new record on Friday, July 3, the only purple dot on the whole chart to fall below trend is July 4. This is likely due to staffing in the public health system over the holiday. But starting with that July 3-5 weekend, the seven-day moving average goes flat for a week, before climbing again for a week, but since around July 17, it has been on a downward slope. Overall, July has ups and downs and a flattening trend. This is very different from the steady climb that late May and June brought.
4. Something interesting is happening with the weekend averages, as well, starting with the July 11 weekend. The numbers stop increasing. In fact, the weekend average case numbers on July 11 and July 18 are identical at 2,117.33. That’s right. Cases were exactly flat during this week in the middle of July, according to the three-day weekend average.
5. Since July 18, cases have not only stopped increasing, they are now showing signs of possibly beginning a downward trajectory. Notice on Sunday, July 19 there were 1,216 new cases, the lowest daily number all month and down to the trendline as of June 30. And with this weekend’s numbers now reported, cases show signs of continuing to slow, with the weekend average as of today down to 1,940 cases.
This is still a lot of cases! Numbers remain very elevated compared to May and June. However, this chart may reveal some signs that the ship is turning. If the coming week brings more of this or better, then a solid downward trend in cases will have developed.
Everyone hopes that the case curve will bend and we can begin loosening restrictions. Unfortunately, nothing in this chart can tell us what will come. But it sure does tell us one thing. The outlook on this fourth Sunday of July is very different than it was back on the fourth Sunday of June.