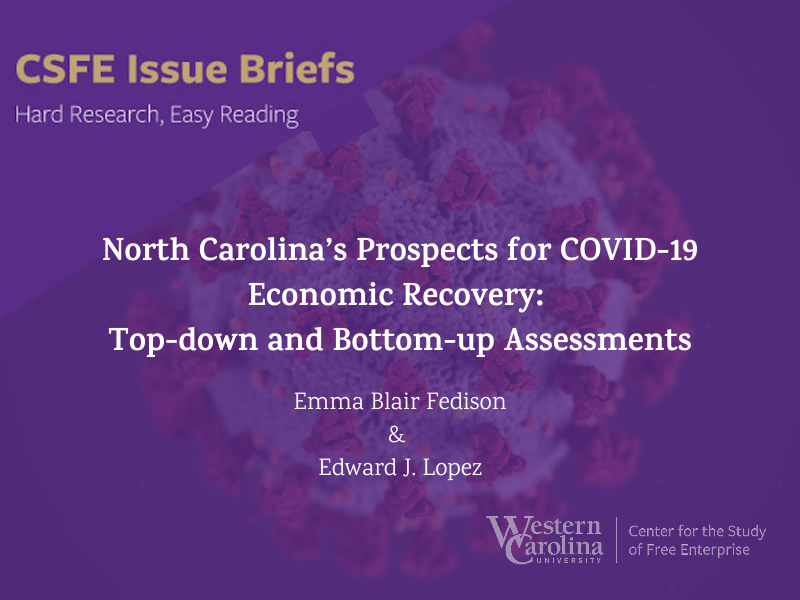
CSFE’s new study on North Carolina’s prospects for COVID-19 economic recovery
We’re happy to release our new study on North Carolina’s prospects for Covid-19 economic recovery. A story in Monday’s Wall Street Journal outlines some of the ways in which Covid-19 economic recovery will be a long-term process. Globally, economic growth is forecast to be strong in 2021, but results will vary wildly by region and sector. Certain markets are not expecting their travel and hotel business to recover until mid-2022, and international air travel is expected to lag beyond 2023.
Here in North Carolina, the labor market has only partially bounced back from the shock of the virus, with over a hundred thousand jobs still to make up. State leaders have voiced their renewed commitment to economic growth and prosperity for all Carolinians. According to our newest CSFE Issue Brief, North Carolina’s prospects for sustained Covid-19 economic recovery depend on having a strong combination of top-down and bottom-up forces at work. Policymakers play a central role in maintaining both. Our analysis shows that the state entered the pandemic relatively well-prepared, with a budget in good fiscal condition, and a healthy climate of economic freedom. We conclude with policy implications across three broad recommendations for maintaining strong top-down and bottom-up forces.
The full study can be viewed or downloaded at our Issue Briefs page, “North Carolina’s Prospects for Covid-19 Economic Recovery: Top-Down and Bottom-Up Assessments.”
Below is the WCU news release.
WCU center examines state’s prospects for economic recovery after pandemic
CULLOWHEE – The Center for the Study of Free Enterprise at Western Carolina University has issued an assessment of economic recovery, sustainability and growth in North Carolina following the pandemic.
According to the U.S. Department of Labor, the state recorded 11,508 unemployment claims for the week that ended Jan. 23, down from a revised 14,177 the previous week. While that is a better status than national unemployment trends, it still reflects an economic slowdown in response to the coronavirus pandemic.
Authored by Edward Lopez, economics professor at WCU and center director, and Emma Blair Fedison, a policy researcher at the center and a graduate student at George Mason University, the study found the state’s prospects for making a sustained economic recovery are sunny, with some qualifications.
“The decisions of today’s policymakers will affect the climate of Covid-19 economic recovery well into the future,” the authors write. “North Carolina’s prospects for sustained recovery are good, underscoring the need to maintain good fiscal health and continue improving economic health in the state.”
The study focused on two main components, the state’s fiscal health and the state’s economic health, as well as the public-private emphasis on a well-trained workforce, modern infrastructure with a strong, competitive tax structure that attracts jobs and investment.
“I’m so appreciative of the timely work that Dr. Lopez and Ms. Fedison have done,” said AJ Grube, dean of WCU’s College of Business. “Their efforts have produced valuable, impactful information for local and state policymakers, which will realize positive effects for the state of North Carolina.”
The researchers said that when it comes to North Carolina’s goals for growth and prosperity, economic freedom indexes are the most important among all barometers of economic prospects for growth, drawing from both the state level data and, using the most recent studies, the municipal level.
“To promote our state’s leaders’ goals of growth and prosperity, our analysis supports three broad policy conclusions,” Lopez said. “Maintain fiscal discipline, a healthy level of economic freedom, and a good balance of economic freedom in the state.”
Founded in 2015, the Center for the Study of Free Enterprise conducts economics research, public forums and thought leadership on issues pertaining to economic development in Western North Carolina and statewide, through students, faculty and staff involvement. The research was funded by the center’s Covid-19 Research Initiative, which received a grant from the North Carolina Policy Collaboratory. For more information, visit wcu.edu/csfe or email csfe@wcu.edu.
Geoff Cantrell, cgcantrell@wcu.edu, 828-227-3079
Meet Dr. Inhyuck “Steve” Ha
Happy New Year from all of us at the CSFE community, we hope you had a happy and safe holiday season. Earlier in 2020, we began our spotlight series on our 2020-21 Faculty Affiliates, and today we would like to highlight Dr. Inhyuck “Steve” Ha. Steve is a Professor of Economics at WCU and has been the director of the MBA program in the College of Business, with research interests in the effects of COVID-19 policy on the economy and the effects of affirmative action programs at the state and national level.
Currently, one of his research areas is focused on the effects of the COVID-19 pandemic policies in the WCU community. Working with CSFE Director, Edward Lopez, and CSFE Associate Director, Sean Mulholland, Steve is specifically developing a statistical model to estimate the economic and fiscal impact of the change in instructional modules at WCU caused by COVID-19 on the community. With a survey already sent out to WCU students, the goal was to find how many stayed home or off-campus, what changes were happening with their spending habits, etc., and then they put that data into a model to show how our local economy was affected.
“We were able to do some in-depth research in that area. So hopefully, we can continue to work on this and extend our research to reach more local businesses and people out there. If we have more resources, then that is more research,” said Steve.
Steve went on to explain how the post-COVID era of society will be different, but just how different is what we are yet to learn, “So I think our approach is to figure out what’s been done. We have a lot of data at the national level, state level, about positive cases and deaths. However, I think it should be done locally, as well. So that’s why we were interested in this research,” said Steve.
When Steve began this line of research, he went to WCU administration curious if there had been any other research done into if students want to take classes online or any other research that might mimic his own, but there wasn’t. The hopeful outcome of his research is to not only answer this question but also how each of WCU’s decisions with their COVID-19 policies has affected students, our local economy, and other rural areas. Steve doesn’t believe this research is a crystal ball into the future, “But if we figure out what has happened and the businesses perspective, then, hopefully, we have a better understanding about some kind of structural change in our economy,” Steve explained.
“These will not necessarily be a policy decision [the outcomes of his research] at the university level, the state level, or the universal level. Still, we should be data-driven,” Steve said, continuing, “That is one of the contributions we could possibly make.”
Steve completed his master’s at the University of Wisconsin-Madison and then went to the University of Minnesota-Twin Cities for a Ph.D. in Applied Economics. He has worked not only in the academic sphere but also has had the opportunity for practical research, working with local businesses, practitioners, and state government officials in a variety of ways. “Then, I found this opportunity at WCU, it has given me opportunities to do some more kinds of practical research, estimating economic impact to the local community, regional economy and state economy,” said Steve.
We are so excited to continue to work alongside Steve with his research, and we look forward to following along with all his upcoming research. In the future, Steve would like to continue this current path of research while also expanding his scope in COVID-19 related policies.
Thank you, Dr. Inhyuck “Steve” Ha for being a part of the CSFE community.

Free Enterprise and the Importance of Social Cooperation
This week, I had a short essay published under the title, “I, Vaccine: How to Appreciate the Beautifully Simple“. In the short piece, I recognize that vaccines are public goods in production and consumption, but mostly I draw attention to the role of globalized markets in vaccine distribution. We can all hope that the vaccines continue to bring success to the battle against the virus. Here at CSFE, we also see the principles of free enterprise at work behind the scenes, helping that story to be the success we all want. In the short essay, I reference a Wall Street Journal article describing the first shipments of Pfizer’s vaccine.
The distribution has been widely described as the biggest mobilization since World War II. Bravo!, I say. We need some awe-inspiring words to befit this marvelous spectacle.
And yet, the vaccine itself is a relatively simple compound. It consists of Pfizer’s modified mRNA plus seven inactive ingredients as common as table sugar. The mRNA itself stands as an unprecedented achievement. Yet the compound is ordinary, even elegantly so. And it will save millions. What beauty in the simple!
For many, this facet of the story evokes the classic essay with the curious title, “I, Pencil: My Family Tree as Told to Leonard Reed”. Originally published in 1958, this essay skillfully describes the materials that comprise an ordinary pencil, and the far reaches of the world whence those materials source. It also artfully describes the innumerable people around the world whose daily work contributes crucially to putting ordinary items such as pencils on nearby stores’ shelves.
That’s exactly how the WSJ describes the Pfizer mobilization. The vaccine must arrive at the right time in the right condition at thousands of locations around the country. And the efforts of myriad numbers of people from faraway places contribute to the mobilization. When you start to think about it, the amount of human coordination being achieved is astounding. It makes my son and me want to ask: Who designed such a marvelous plan? Who deserves credit for taking charge of this? The surprising answer that comes to us from the pencil is: no one!
This is a time-tested idea in economics, that global trade at market prices carries salutary side benefits, one of which is a ready-made system for distributing the vaccine. CSFE is a university center, and I always stress that our content must be well-grounded in research, specifically research that is scrutinized by other scholars in the respective academic disciplines. Free enterprise principles are not about being pro-business or anti-government, and they’re certainly not about partisan politics or culture wars. There is a centuries-old lineage of well-respected thinkers helping to understand the connections and limitations between economic freedom and social betterment. My one-time mentor and co-author, Peter Boettke, is among those thinkers. In his essay from January 2020, “Four pillars of Economic Understanding,” Pete does a wonderful job connecting the hard and analytic side of economic reasoning with the nuanced and aesthetic side of economic thinking. Sound economics is about understanding “the importance of social cooperation among distant and disparate people, rather than the ruthless competitive nature of market society. Yes, market competition is unrelenting and valuable. But the by-product isn’t just the delivery of goods and services at least cost, but also the network of social relationships and bonds of cooperation that are formed even among strangers.”
We wish you and your networks very happy holidays and a prosperous new year.
Meet Martin Tanaka
Continuing with our spotlight of our 2020-21 Faculty Affiliates, we want to highlight one of our affiliates, Martin Tanaka, and his exciting work. Martin is an Associate Professor in the School of Engineering and Technology at WCU, who is interested in applying mechanical engineering principles to biomedical problems. He accomplishes this using the principles of product design, design optimization, and computational modeling and simulation.
Martin completed his undergraduate degree in mechanical engineering at NC State, followed by a master’s degree in engineering mechanics at Virginia Tech, and then earned his Ph.D. in biomedical engineering from Virginia Tech and Wake Forest University. Martin is now finishing up his 11th year at WCU, although his focus has not been solely academic. Martin has many years of industry experience with product design and development as well, including working for Texas Instruments and developing products for Mercedes Benz.
He no longer works in the industry, but this background has given him insight into how academics can help technical businesses thrive. With CSFE’s support, Martin is focusing on investigating the elements that businesses, with a special focus on biomedical device companies, need to establish, grow, and sustain healthy, beneficial collaborations with academic partners.
“How do you strengthen it, maintain it, nurture it, and feed it? It’ll grow beyond just what you originally had because now you not only have the professional interaction, you also are developing personal relationships,” Martin said, continuing on, “People get to know people, they work with people, they hear about things that are going on in people’s lives, these are some of the things that should accelerate it, keep it going.”
Sometimes just a little help is all that is needed. A healthy collaboration is symbiotic, and innovation is likely to spark if the environment is right. “If I’m helping a business, say, with engineering, seeds of innovation can form. The partnership is like adding a little fertilizer and water to help ideas grow a little bit better. And if they grow better, then it’s more likely that something useful is going to emerge,” noted Martin.
Currently, Martin is also working with the American Society of Mechanical Engineers (ASME) to develop standards to test the mechanical properties of biological tissues. Material properties could be entered into a database for individuals and groups around the world to use. This will make the process of developing new medical devices more streamlined and give each developer a standard to go by. Access to this information can increase innovation, efficiency, and timeliness within businesses and reduce barriers to entry for small businesses in the biotech sector.
Through this exciting research, Martin hopes to accelerate the approval process for new biomedical devices, which would allow these devices to get into the hands of individuals who need them more quickly and at a lower cost.
We at CSFE are proud of all of Martin’s work so far and are looking forward to seeing what is to come. To look at his past research and work, click here.
Meet Audrey Redford
Early in November, CSFE announced our 2020-21 Faculty Affiliates and our plan to spotlight each one of them and their exciting research. Today, we want to highlight one of our affiliates, Audrey Redford. Audrey is an Assistant Professor of Economics in the College of Business at WCU, with research interests in Austrian economics, public choice, and the unintended consequences of drug prohibition as well as interventionism and entrepreneurship in illicit drug markets. Audrey was a presenter on our interdisciplinary panels at our 2019 Opioid & Addiction Town Hall.
Audrey earned her Ph.D. in Agricultural and Applied Economics from Texas Tech University in 2016, then landed a job at WCU upon her graduation. It was from Audrey’s mother, a Substance Use Disorder Counselor, that Audrey first noticed her interest in the research of illicit drug markets and substance misuse. Throughout her education, she found that economics was the perfect lens to dive deeper into her field of interest, thus her path for research was born. “Economics became a useful tool for me to understand this thing that I cared a lot about,” Audrey said.
Audrey’s research for CSFE has two parts, the first is taking a deeper look at the unintended consequences of United States policies regarding drug and alcohol use during the Covid-19 pandemic. Secondly, and her main area of research, is understanding the consequences of North Carolina’s death by distribution law. NC’s death by distribution law is designed to allow prosecutors to potentially charge drug dealers with second-degree murder that sell a substance that unintentionally leads to an overdose death.
“One of the big concerns that I have about that [NC’s death by distribution law] is how is that going to change the nature of people that are selling those drugs?” Audrey asked, noting, “There’s some evidence to suggest that a lot of people when they purchase these substances, purchased them from people they know. Does this new law create an incentive for those known sellers to stop selling to people that they know?”
The second of her concerns being that this law in conjunction with North Carolina’s good Samaritan law could potentially leave individuals now being fearful of having law enforcement involved if they call 9-1-1 for an overdose, even if it would save a life.
Through this research, Audrey hopes to educate people further on drug use and the unintended consequences of policies being made and to show how policymakers and individuals alike could make positive, impactful changes, “We can see that drug probation or increasing drug laws is doing almost the exact opposite of achieving the goal. So even if myself and whoever this the imaginary person is that I’m talking to have different endpoints, I can use their end goals as givens and try to show them using economics, why that’s not being achieved,” Audrey explained.
Audrey is excited to continue in both areas of research during the Spring, and we are proud of all her work so far and the work in the coming months. You can follow Audrey’s work here.

Meet Craig Richardson
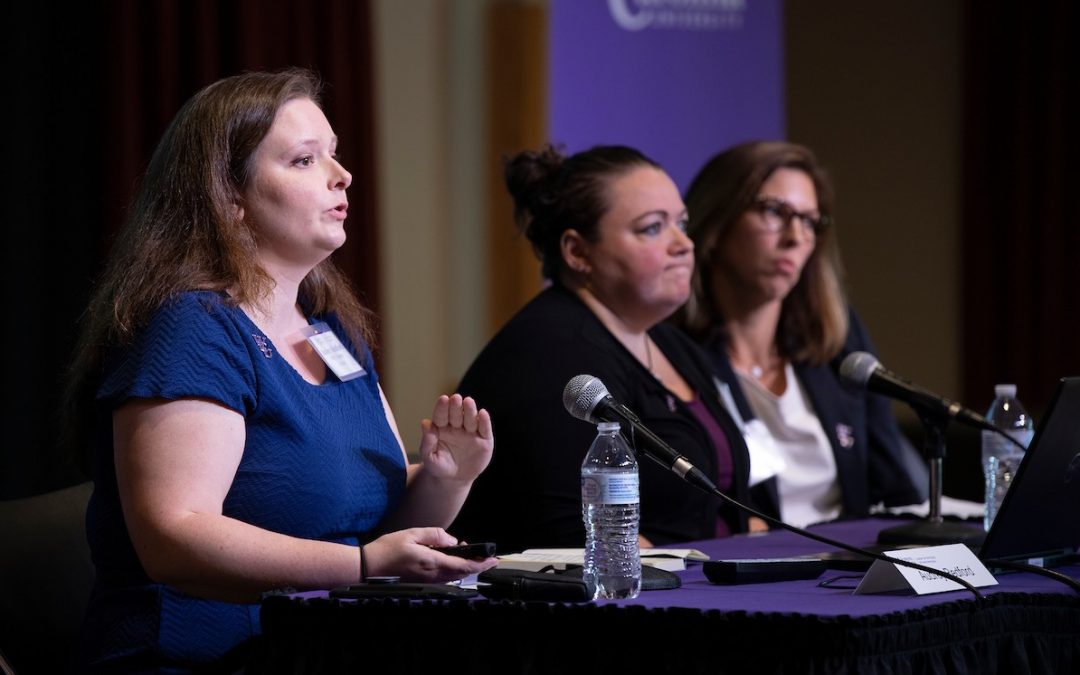
Here at CSFE, we hope everyone had a great Thanksgiving holiday. Earlier last week, CSFE Content Marketing Specialist, Allie Todd, talked with Craig Richardson. As Director of the Center for the Study of Economic Mobility (CSEM) and the BB&T Distinguished Professor of Economics at Winston-Salem State University, Craig oversees the center’s research team of eleven CSEM Faculty Fellows and works with Associate Director Alvin Atkinson on community outreach and student internships.
The mission of CSEM is focused on exploring the causes for the extraordinarily low economic mobility in Forsyth County, North Carolina, where Winston-Salem State University is located. It seeks to implement programs to enable people to gain economic mobility. Craig noted, “We have an interdisciplinary center, but it has economics at its heart. If you’re born poor here, it is hard to get out of poverty, so CSEM was founded on the idea of the metaphor of a ladder of economic mobility. What are those missing rungs, or broken rungs, that keep people from ascending, and what might be some policy changes or some private sector initiatives that could enable people to ascend that ladder?”
Recently, CSEM made a documentary titled, “Bus Stop Jobs,” that tells the story of the typical day of a bus rider in Winston-Salem, which aims to shed light on the juggling act of working and raising a family all while enduring the long bus commutes each day. “This has led to the local Winston-Salem Foundation, which is the largest foundation in the area, giving close to $200,000 in innovation and transportation grants to eight different organizations in the county, which have now explored their own ideas,” said Craig.
CSEM is dedicated to not only researching the gap in economic mobility in Forsyth County but with that research, creating a tangible, positive change. Craig’s vision with CSEM is to be an independent source of information for Forsyth County, providing other area organizations useful data that shows what works best at reducing poverty.
“Our vision is to look at long term solutions to poverty and enable people themselves to lift themselves up. But we must also be aware of what those hurdles are that have been put in place that keeps people from doing that,” said Craig. “So, we start from the perspective that people aren’t passive, people aren’t lazy, they’re hard-working at the bottom of the ladder, just like they’re at the top. The vision is to allow them to have the same opportunities to achieve the American dream as everyone else does. We do that with an interdisciplinary research approach that enables us to have our talented Winston-Salem State faculty giving light to these problems from different points of view.”
The missions for both CSFE and CSEM are similar, and there have been multiple times where our paths have crossed. Our Director, Edward Lopez, has been working with Craig and CSEM on Covid-19 research this fall, along with previously working on policy reports together, “This has been a great collaboration, both formally and informally,” said Craig. We’re researching some of the same basic questions of economic opportunity and mobility but in different contexts. Craig has brought a lot of clarity and attention to problems in urban settings. We’re working to fill that gap in rural, mountainous settings like WNC.
Going forward, CSEM’s latest research fellows are working on upward mobility for the previously incarcerated, as well as improving economic mobility for the disabled. Another project, led by Craig, is a first of its kind project for Forsyth County: it analyzes the economic benefits of Forsyth County’s first-time homebuyers’ program for low-income individuals and families. Although more than 800 families have benefited, prior to CSEM, there had never been an analysis of the return on investment. Early results of the empirical analysis indicate that for $1 the government spends on down payment assistance, these beneficiaries gain almost $9 in accumulated wealth through housing equity, which puts them on a very different path than renting a house. “Notably, because of government regulations through the Dodd-Frank bill, it is nearly impossible to get a mortgage for less than $70,000- banks don’t find it profitable any longer. So, programs such as these can help as a second-best solution,” Craig noted.
The second project is partnering with a software developer to develop a program that helps low-income individuals navigate the maze of social welfare, which typically punishes those who work harder or get raised through substantial rollbacks in aid. “Oftentimes, people can get say, a raise from $10 to $12, but they end up making no more money,” Craig said, noting, “The poor get the lowest reward for working if they end of up on welfare programs, facing “disincentive deserts.” He aims to work with local employers to come up with creative solutions that sidestep these disastrous poverty traps and allow them to give incentives that promote upward economic mobility.
We are proud to work with Craig and CSEM, and excited to see what comes next for them.
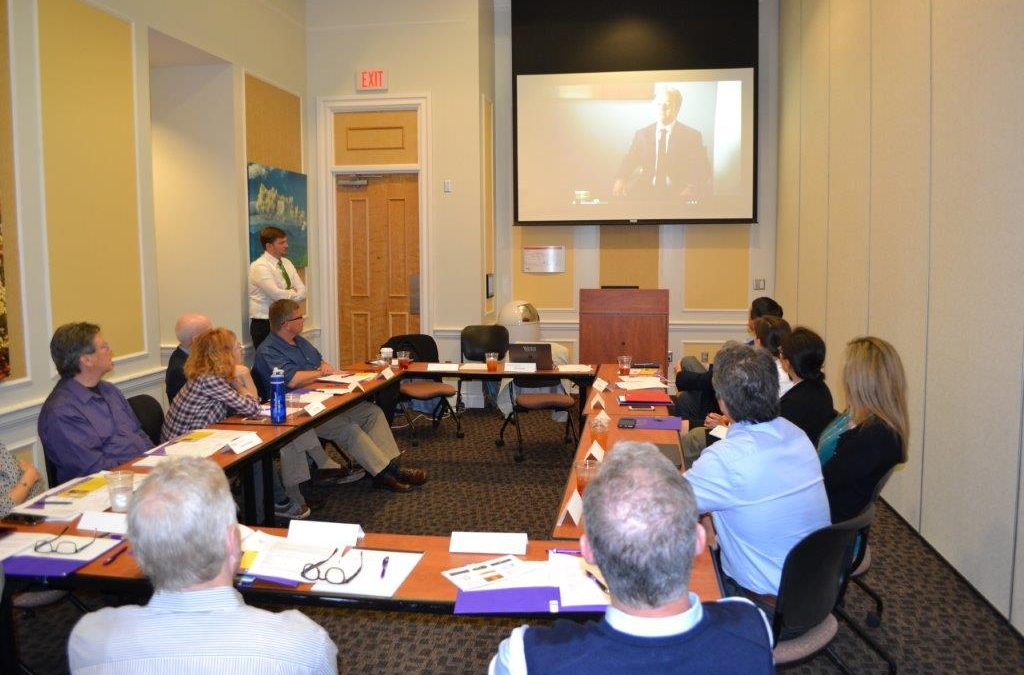
Advisory Board meeting set for Wednesday December 09
CSFE’s Advisory Board will hold its Fall 2020 meeting virtually on December 9, 2:00-3:30 p.m. As a university center in the UNC System, CSFE is governed by University of North Carolina Policy 400.5[R] and by the Center’s bylaws which were adopted in 2017. The Advisory Board consists of six current WCU faculty members appointed by the Provost, as well as five distinguished members of the community from the private and public sectors, and the Director as a non-voting ex officio member. As designed the board’s purpose includes the following responsibilities:
- Advocate for the Center and the University;
- Advise the Director on the Center’s strategic plan, budget, and activities;
- Deliver advice on potential future Center initiatives;
- Remain active in Center events, meetings, and discussions;
- Provide suggestions as to additional resources that may be able to add value to the Center;
- Provide input and recommendations on how to keep the Center’s programs relevant and innovative.
A roster of current Advisory Board members can be found on our CSFE People Page. CSFE Advisory Board meetings are open to the public; if you would like to attend, please email csfe@wcu.edu for details to join the Zoom call.
Meet Jackson Déziel
Earlier this week CSFE announced our 2020-21 Faculty Affiliates, all of whom we are very excited about working with during this coming year. Today, we want to highlight one of our affiliates, Assistant Professor and Director of the Emergency Medical Care program at WCU, Jackson Déziel.
As a paramedic by trade, Jackson has been in Emergency Medical Services, EMS, for almost 20 years. With a Ph.D. in public policy from the University of North Carolina-Charlotte and a Masters of Public Administration from North Carolina State University, his research focuses on EMS, health economics, and public policy.
Currently, his academic research focuses on the function of health economics when it intersects with emergency medical services, “I’ve recently done work with economic signaling theory with budget maximization theories, then bringing EMS into that and saying that these theories still hold, just because we are not a hospital or nursing unit doesn’t mean these aren’t true,” said Jackson.
For his research with CSFE, Jackson will be focusing on emergency medicine policy regarding the Covid-19 pandemic; how we have responded, how we should have responded, how we will continue to respond, which practices and policies have worked, and which have not worked.
“I’m going to be focusing on the systems that we had in place, that did not prepare us for this. From an emergency medical services standpoint, we have this National Incident Management Systems that we are trained on and that tells us how to respond to these big events, but we have learned that we were trained for one-off, singular events,” said Jackson. “Then, with this pandemic, we tried to use our training to manage the pandemic, but there is no real start and there is no real stop. This is not a one-off, localized event, it is happening everywhere.”
Jackson hopes with this research, along with the research being conducted globally, that there will be an effective change to local, regional, and national policy to handle these types of events in emergency medicine. Locally, Jackson hopes to see an increase in community paramedics to serve underrepresented populations in our rural area, “As a vaccine comes down the pipeline, as testing gets more and more widespread, especially in this rural area where it’s not easy for people to get primary care and the access to health care isn’t there,” Jackson said. “We in the EMS area would have an opportunity to go out directly to them.”
We are very excited to welcome Jackson Déziel as a member of our Faculty Affiliates and to witness the impact of his research. On the horizon, Jackson is looking towards doing more research on the mental health of first responders and has recently submitted a piece on EMS demand in relation to social determinants of health.
Thanks to Jackson for making his work a part of CSFE.
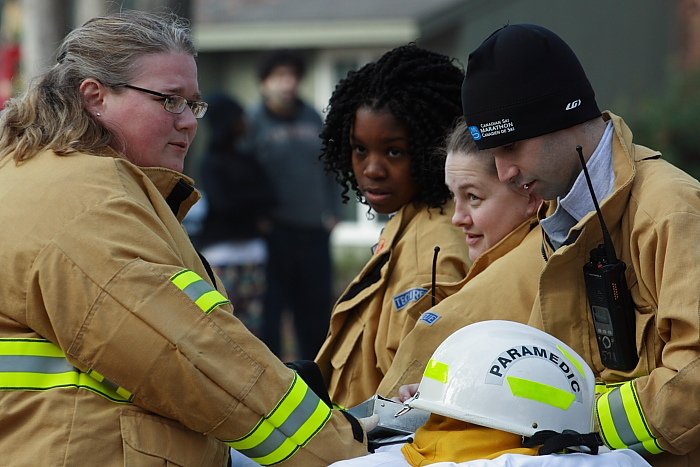
Photo by Mike Legeros, @LegerosFire

Introducing CSFE’s 2020-21 Faculty Affiliates
We are happy to introduce our CSFE Faculty Affiliates for 2020-21. Our goal with the Faculty Affiliates (FA) program is to gather the work of faculty and their students from various disciplines who are working on subjects related to our areas of support, especially Covid-19 impact and recovery. With the FA program, we set out to connect faculty from different parts of campus, to draw lessons by combining their interdisciplinary perspectives, and to increase impact by integrating faculty and their students with people in our communities where needs are greatest.
Our 2020-21 cohort initially begins with 12 faculty from six disciplines representing four of WCU’s six colleges. Their work covers a range of topics and is improving understanding of Covid-19’s impact on diverse populations, and on the best conditions for recovery.
- Jackson Déziel, assistant professor, director of the Emergency Medical Care Program, will examine emergency services response to the pandemic and pertinent policy actions
- Angela Dills, Gimelstob-Landry Distinguished Professor of Regional Economic Development, will research the effect of telehealth parity laws on mortality rates
- Turner Goins, Ambassador Hyde Distinguished Professor of Gerontological Social Work, will conduct interviews and analysis of those 65 years and older and their experiences with COVID-19
- Inhyuck “Steve” Ha, professor of economics, will measure the economic impact of a WCU closure on the campus and the region
- Marco Lam, associate professor of accounting, will study the municipal bonds market and public policy implications
- Edward Lopez, professor of economics, is studying attitudes toward and conditions that support bottom-up rural economic development
- David McCord, professor of clinical psychology, will research postpartum depression and, with students, develop a new screening method
- Emma Miller, assistant professor of social work,is studying post-traumatic growth as it relates to Covid-19 in WNC
- Stephen Miller, Adams Bibby Chair of Free Enterprise at Troy University (and former WCU professor of economics), will conduct a comparative analysis on the impact of COVID-19 on states and regions
- Sean Mulholland, professor of economics, will study the impact of the pandemic on small businesses in the travel, hospitality and entertainment business sector
- Audrey Redford, assistant professor of economics, will examine the impact of North Carolina’s “death by distribution law” on unintentional drug deaths
- Martin Tanaka, associate professor of engineering, will investigate mutually beneficial industry and academic partnerships for communicating (specifically Zoom)
You can read a bit more about these stellar individuals and their students at our CSFE People Page. Throughout the academic year and beyond, we will profile each of our FA’s and their students, promote their work, and look for connections with needs in our communities. So please keep an eye out for more on this blog and on our social media. We couldn’t be more excited to be partnering with our 2020-21 FA’s!
The importance of political institutions to human flourishing: New CSFE Issue Brief
At CSFE, our mission is to study the role of free enterprise in a flourishing society. Political institutions often take center stage in the analysis. Political institutions act like vital social infrastructure on which people build their lives. Elections provide for peaceful transition of power. The division of government into co-equal branches provides checks and balances against abuse of power. Courts uphold regulations and enforce rights to person, property, contract, and economic opportunity in general. All this and more depend on sound political institutions, which promote a more predictable social climate for people to pursue their plans and projects and over time thrive. When political institutions work well, people enjoy freedom and prosperity. Over the generations and centuries, this has been a major theme in the unfolding American story.
Yet political institutions don’t come free. They are high maintenance, always needing to be monitored, enforced, and strengthened in their defenses. As the founding sentiment goes, eternal vigilance is their price. And sure enough, the first two decades of this century have tested our political institutions mightily, first with the war on terror, then the Great Recession, occupy and tea party movements, polarization, populism, racial and gender injustice, foreign interference, information conspiracy, and now a global pandemic. All of this gathers to a point in this historic general election. In the heat of the moment, we at CSFE invite you to pause and give democracy a check-up. How are American political institutions doing these days?
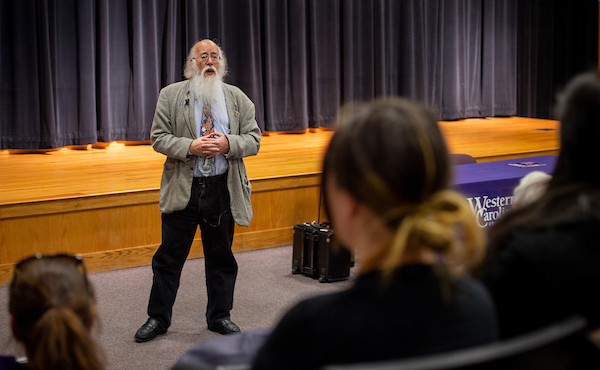
Our latest CSFE Issue Brief is written by Loren Lomasky, a University of Virginia philosopher who has spent his career teaching and writing at the intersection of politics, ethics, and human flourishing. I first met Professor Lomasky over 15 years ago at a conference on education. We became friends and have stayed in touch, so in 2018 before the midterm elections I invited Loren to come to WCU for a public talk on the current state of democracy. Before his visit, Loren gathered his remarks into about 3,500 words, and we are now happy to make it available for our readers to ponder.